
In progress
More businesses on the way.
We’re building and launching new South Florida client sites right now. Case studies go up when the client agrees to be named.
Home/Client work
Client work
Four website case studies covering what the client needed, what we built and why we made the calls we did. On the builds, no traffic charts and no invented conversion lifts, the measurement window belongs to the client. Where we do publish figures, they arrive with their source and window attached.
Founded 2026 · South Florida
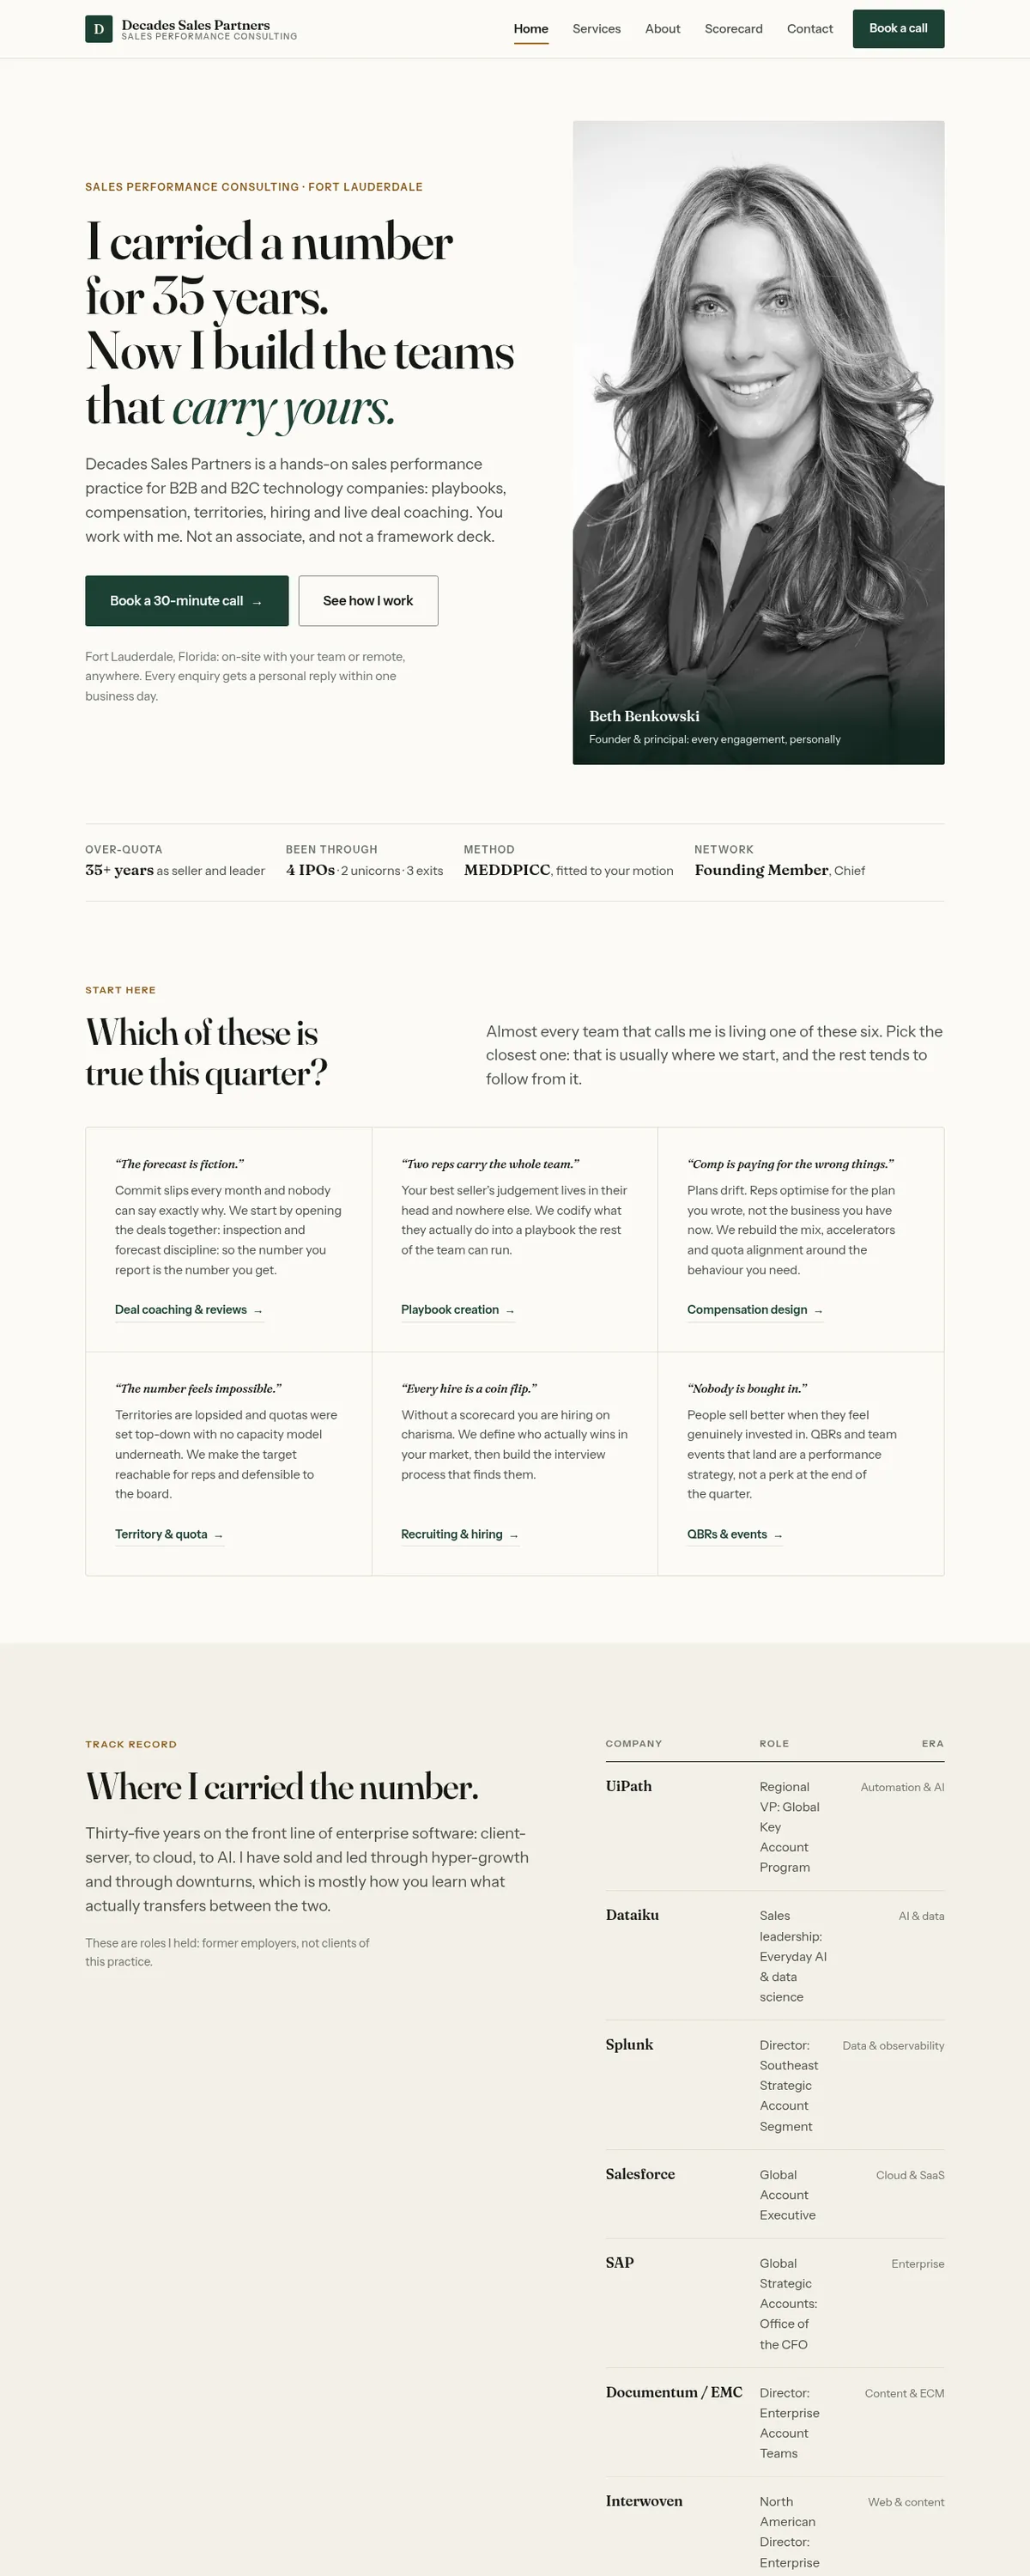
01 Sales performance consultancy · Fort Lauderdale
A consultancy site that had to carry 35 years of credibility.
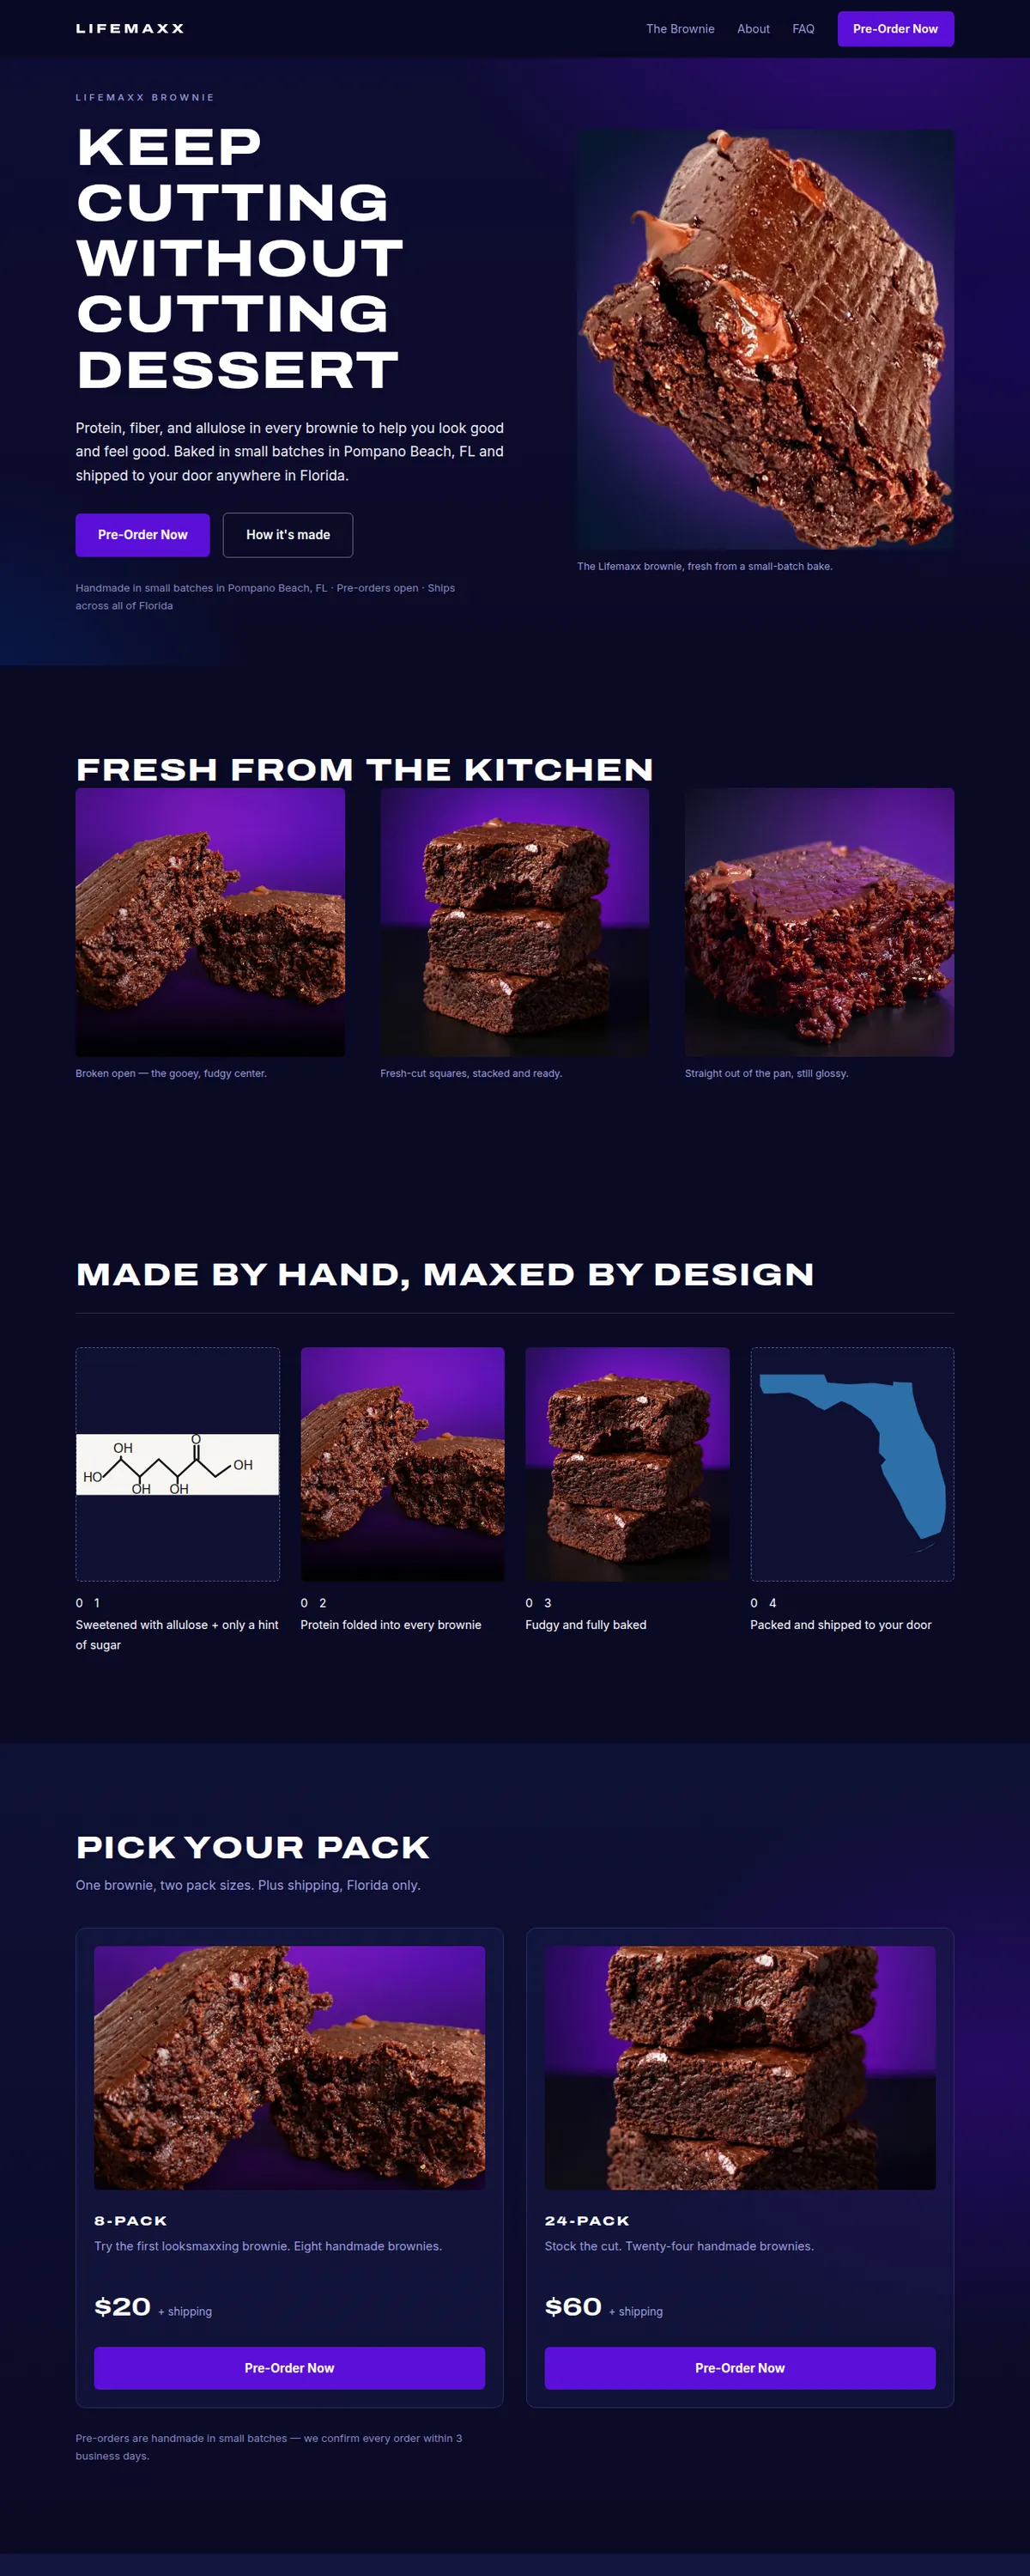
Read the case study02 High-protein brownies · Pompano Beach
A pre-order storefront for a brownie that has to sell twice.
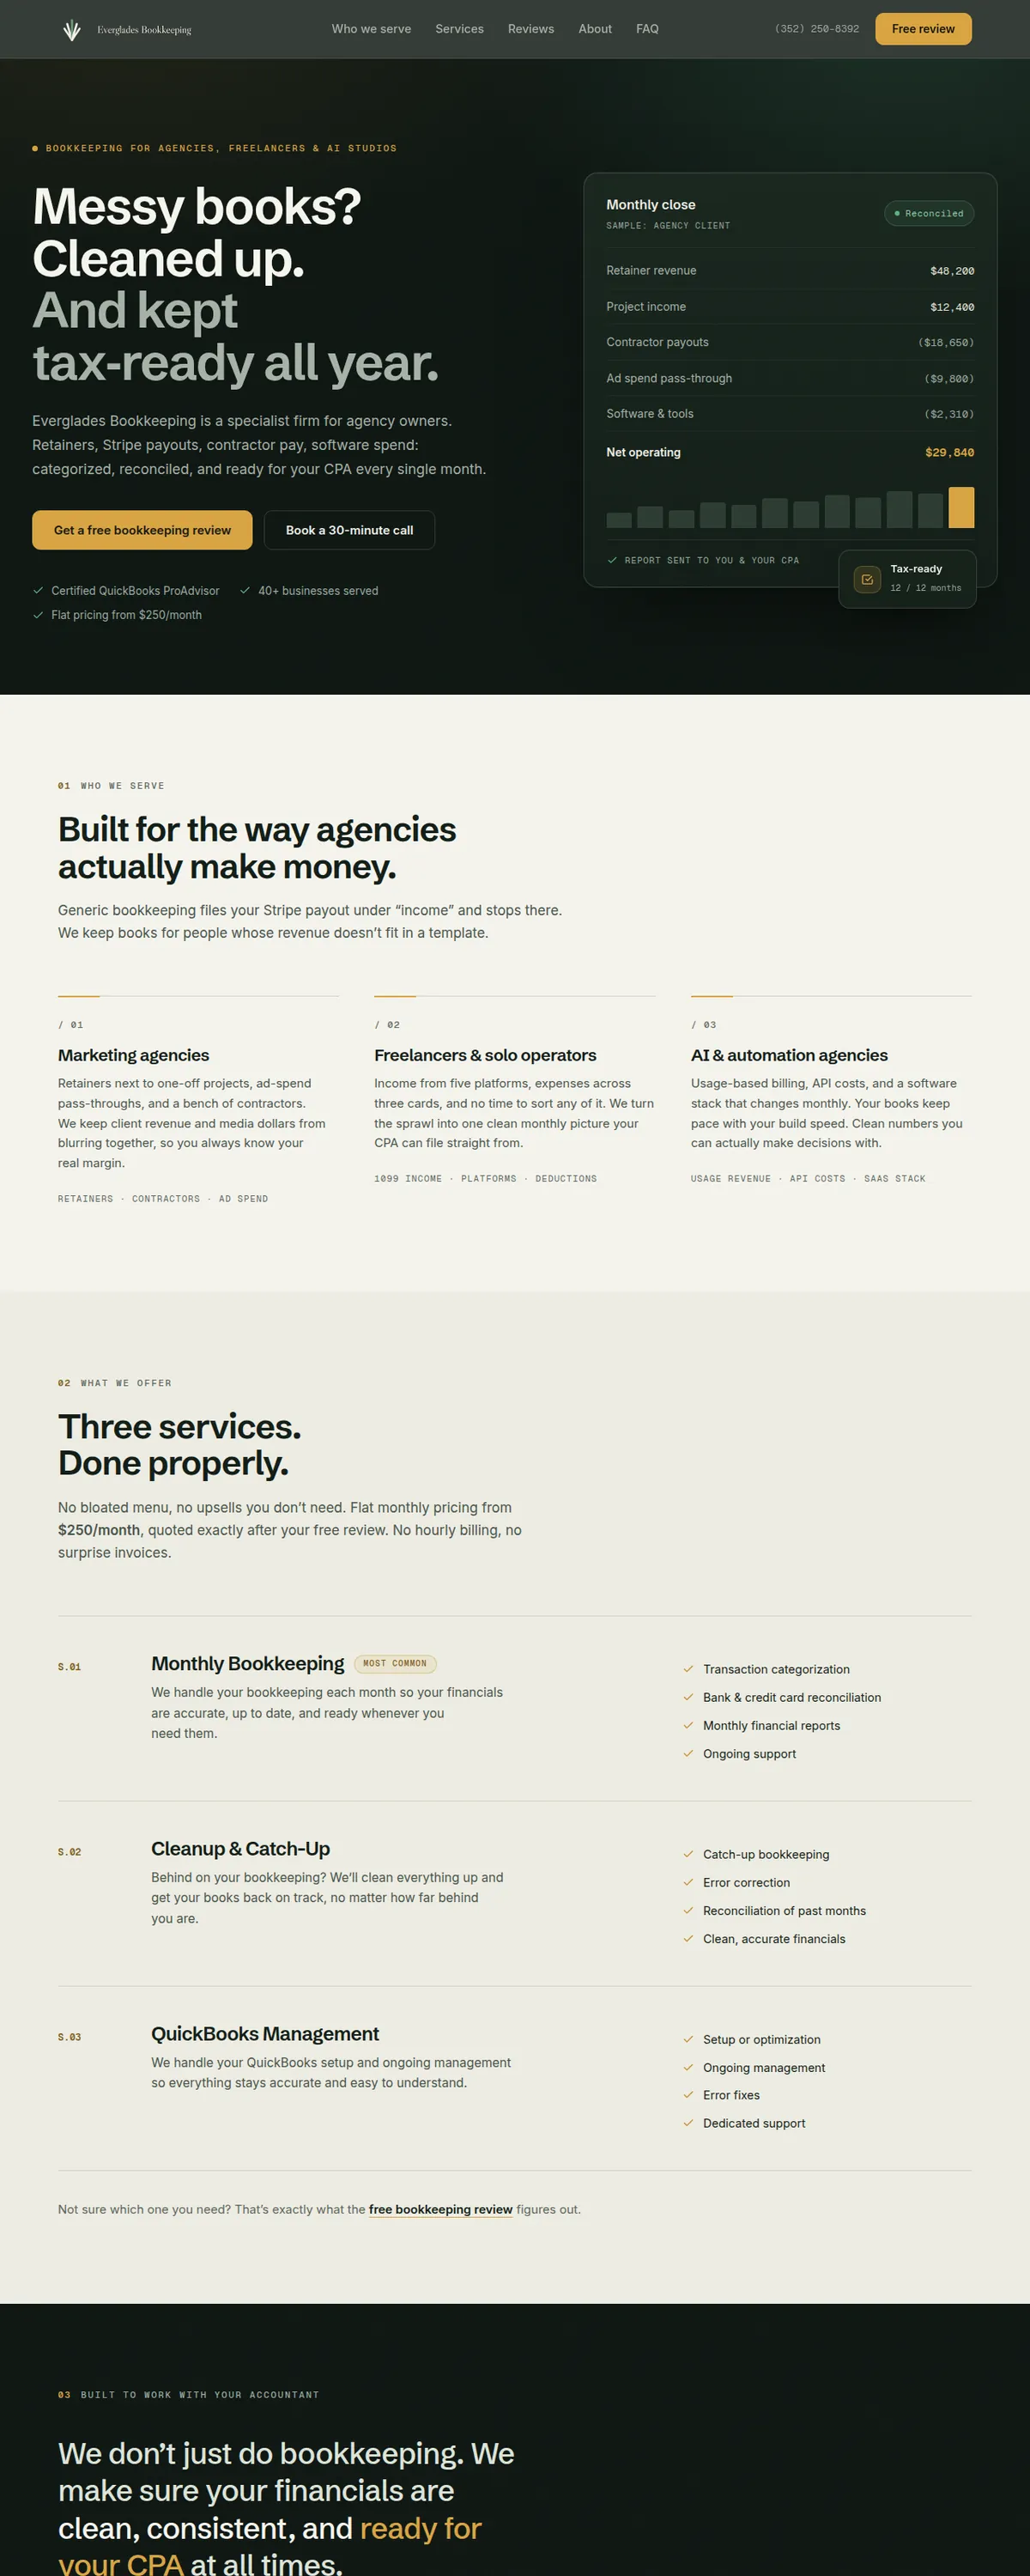
Read the case study03 Bookkeeping · South Florida
A launch where the mail mattered more than the website.
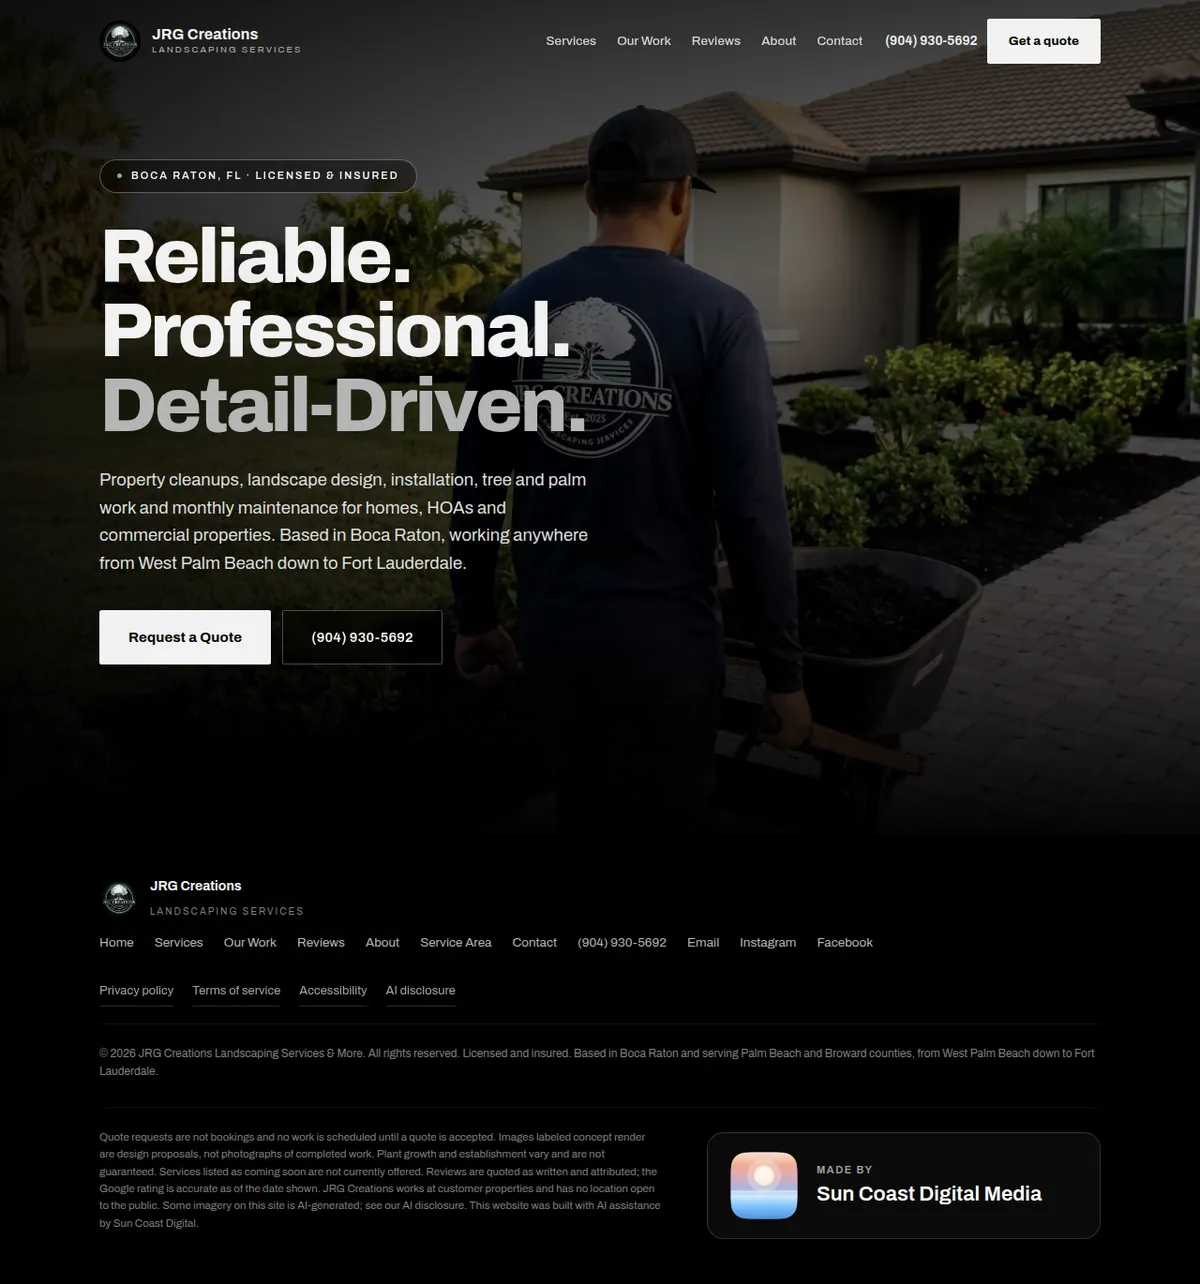
Read the case study04 Landscaping · Boca Raton
Getting a working business off a page builder it had outgrown.
Read the case studyIn progress
We’re building and launching new South Florida client sites right now. Case studies go up when the client agrees to be named.
01 Why there are no numbers on the website builds
Agency case studies are full of percentages, and almost none of them state the measurement window, the baseline, or who did the measuring. We do not publish figures we have not independently verified, so the website case studies above describe the work rather than claim the result. Where a client’s own platform reports the number, as in the content work below, we publish it with the source and the measurement window attached.
If that reads as a weaker pitch than the competition’s, it is, right up until you ask a competitor how their number was calculated.
02 Content & social
Personal brand · Short-form video
Miles Stanislaw · @themilesstanislaw · Miami, FL
Miles Stanislaw is 83 years old, a national waterski champion, a career litigator and the author of “The Worm Farmer.” He came to Sun Coast with no audience online.
We build the account: a weekly shoot with Miles, short-form video on a near-daily cadence, and a production pipeline that turns raw phone footage into retention-cut vertical video, the claim on screen inside the first second, captions burned in, and the audio rebuilt so every word lands over wind and boat noise.
The three reels that carry it
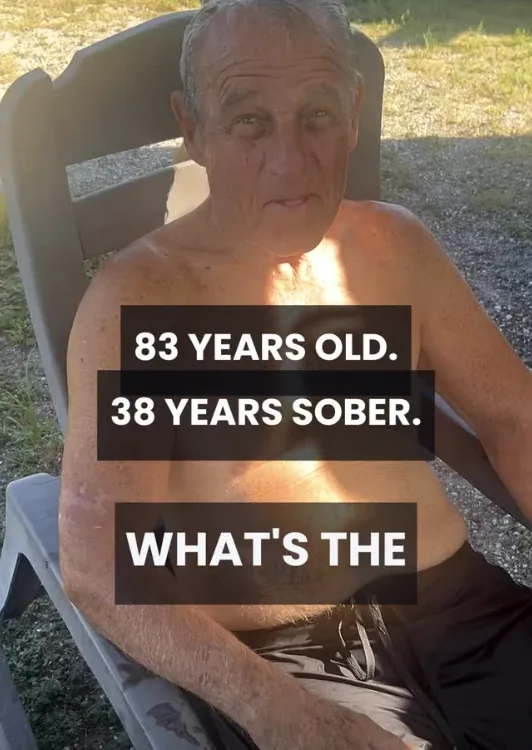 790,528“83 years old. 38 years sober.” 347,252 on the original post, 443,276 on the repost.Watch on Instagram
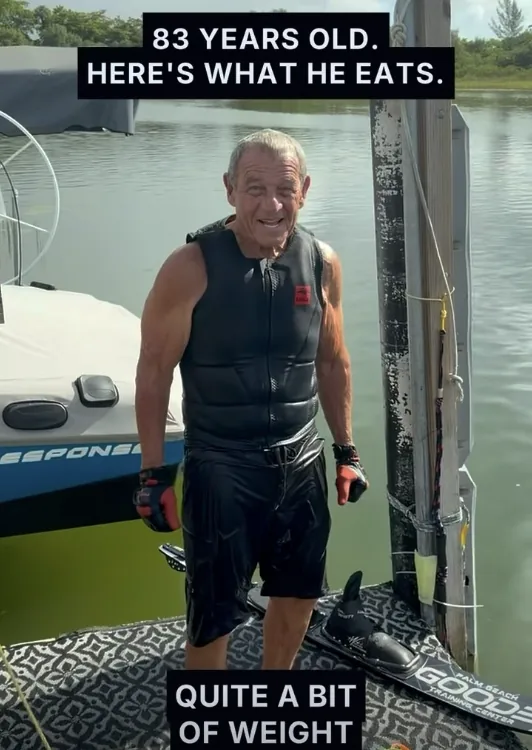 23,361“83 years old. Here’s what he eats.”Watch on Instagram
 11,913“Actually 83.” On the water, in his own words.Watch on Instagram
None of that reach came from an existing audience. Miles had no followers and no attention online before this account started posting, so every view above was earned from a standing start. Instagram’s own daily chart is flat until the last week of August.
The biggest single thing we did in this window was not a new video. One reel had done 347,252 views, so we posted it again with different audio. That repost has done 443,276 on its own, more than the original earned, and it is why the account’s best day was its last. Knowing which reel is worth running again, and when, is part of the service: 27 posts in about a month, every one measured, and the winners put back into rotation.
The account continues to grow week over week under Sun Coast’s management. We are not projecting where it goes next, and nobody honestly can. What is above is what the platform reported for one stated window.
Figures read from Instagram Insights for @themilesstanislaw: views, viewers and the non-follower share cover the 30 days from 25 August to 23 September 2026; the follower count is from the profile as at 24 September 2026. The per-post view counts are read from each post’s own Insights panel, current as at 24 September 2026. The account began posting in late August 2026, so the earliest days of that window sit before the first post. A 30-day window is a rolling one, and the figure moves as the window moves. The view count on each reel shown here is that post’s lifetime total as at 24 September 2026, so it is not confined to the 30-day window, and the first reel was published twice, which is why its two figures are given separately. The 30-day view total also counts reels published to non-followers as trials, which Instagram does not show on the profile, so the posts visible on the grid will not add up to it. These are the client’s own platform numbers, published with their source and measurement window, not an agency-calculated result.
Book a free 15-minute call. We’ll bring a custom mockup of your future site.